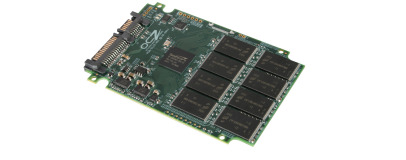
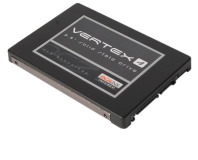
OCZ Vertex 3 SSD Preview
Written by Harry Butler
February 24, 2011 | 14:37
Tags: #ocz-vertex-3 #vertex #vertex-3
Companies: #ocz #sandforce

ATTO Disk Benchmark Results
Website: ATTO Disk BenchmarkWith Window 7's improved caching technology, our traditional sequential read/write benchmark, FC -Test, was no longer practical to use, due to data being immediately cached and thus invalidating our copy and read performance figures.
Instead, we've opted for ATTO disk benchmark as a straightforward but surprisingly popular tool for testing a hard disk or SSD's ability to deal with reading and writing files of various sizes. The benchmark sequentially writes and reads files varying in size from 0.5KB to 8MB, and can also be adjusted for overlapped I/O and a variety of queue depths, although we've tested using the benchmark's default settings, recording 1,024KB file performance.
ATTO's 256MB benchmark uses extremely compressible data, allowing drives that use compression based storage, such as those based around SandForce's drive controllers, to achieve their absolute maximum performance. This, however, rarely translates into real world performance due to the majority of today's data being at least partially compressed.
ATTO Disk Benchmark
1,024KB Compressible Sequential Read Speed
- OCZ Vertex 3 240GB (SandForce 2281)
- Crucial C300 256GB (Marvell)
- G.SKill Phoenix 100GB (SandForce 1222)
- Intel X-25M 160GB
- OCZ Vertex 120GB (Indilinx Barefoot)
-
-
538
-
-
-
368
-
-
-
265
-
-
-
265
-
-
-
258
-
0
100
200
300
400
500
600
MB/sec, Higher Is Better
-
Average Random Read
ATTO Disk Benchmark
1,024KB Compressible Sequential Write Speed
- OCZ Vertex 3 240GB (SandForce 2281)
- G.SKill Phoenix 100GB (SandForce 1222)
- Crucial C300 256GB (Marvell)
- OCZ Vertex 120GB (Indilinx Barefoot)
- Intel X-25M 160GB
-
-
516
-
-
-
266
-
-
-
232
-
-
-
197
-
-
-
105
-
0
100
200
300
400
500
MB/sec, Higher Is Better
-
Average Random Read
ATTO Disk Benchmark
64KB Compressible Sequential Read Speed
- OCZ Vertex 3 240GB (SandForce 2281)
- Crucial C300 256GB (Marvell)
- Intel X-25M 160GB
- G.SKill Phoenix 100GB (SandForce 1222)
- OCZ Vertex 120GB (Indilinx Barefoot)
-
-
429
-
-
-
351
-
-
-
261
-
-
-
255
-
-
-
246
-
0
100
200
300
400
MB/sec, Higher Is Better
-
Average Read Speed
ATTO Disk Benchmark
64KB Compressible Sequential Write Speed
- OCZ Vertex 3 240GB (SandForce 2281)
- G.SKill Phoenix 100GB (SandForce 1222)
- Crucial C300 256GB (Marvell)
- OCZ Vertex 120GB (Indilinx Barefoot)
- Intel X-25M 160GB
-
-
470
-
-
-
264
-
-
-
231
-
-
-
194
-
-
-
104
-
0
100
200
300
400
500
MB/sec, Higher Is Better
-
Average Read Speed


Want to comment? Please log in.