Cinebench R10 64-bit
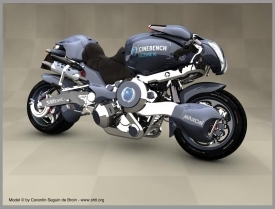
Download from: www.maxon.netCinebench R10 uses Maxon's Cinema 4D engine to render a photo-realistic scene of a shiny motorbike. The scene is highly complex, with reflections, ambient occlusion and procedural shaders so it gives a CPU a tough workout.
The test can be in run in single-threaded 1CPU mode or multi-threaded xCPU mode - just click the respective button. In this way, Cinebench R10 is useful for gauging the performance of each execution core of a CPU, as well as its overall performance.
As Cinema 4D is a real-world application - used on films such as Spider-Man, Star Wars among others - Cinebench R10 can be viewed as either a real-world benchmark or a theoretical one.
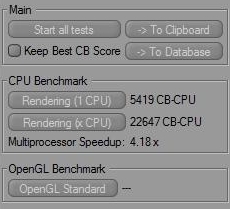
Read the Overclocking page to see how we acheived our overclocks, and the Performance Analysis page for what these results mean.
WPrime
Download from: www.wprime.netWPrime is a multi-threaded maths calculation benchmark that counter-intuitively uses square roots rather than prime numbers. The standard benchmark uses 32 million numbers, calculating the square root via 'a recursive call of Newton's method for estimating functions'. We're not sure what that means either, but you can read the full blurb on WPrime's About page. What we do know is that WPrime scales well across multiple CPU cores, and can push a CPU to 100 per cent load on all its cores.
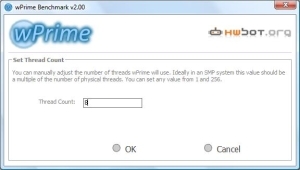
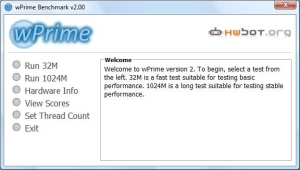
To run the benchmark, first visit the core count to check that WPrime will load all physical and logical cores, and then run the 32M test. The results are expressed as a time taken to calculate the square root of the set of numbers (32 million in the standard test). A lower score is better.
Read the Overclocking page to see how we acheived our overclocks, and the Performance Analysis page for what these results mean.

MSI MPG Velox 100R Chassis Review
October 14 2021 | 15:04




Want to comment? Please log in.