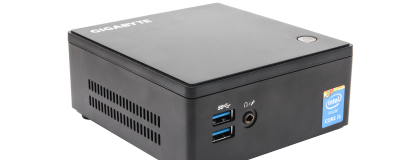
Gigabyte BRIX S GB-BXi5H-5200 Review
Written by Antony Leather
March 23, 2015 | 13:09
Tags: #80211ac #broadwell #broadwell-nuc #htpc #intel-nuc #intel-nuc-review #m2

Power Consumption
For the power consumption tests we aim to gauge real-world power draw. The power draw is measured via a power meter at the wall, so the numbers below represent the total system power draw from the mains, not the power consumption of a CPU itself. Measuring the power draw of any individual component in a PC is tricky to impossible to achieve. We used Prime95 to fully load the CPU.Idle Power Consumption
For this test, we leave the PC doing nothing but displaying the Windows 7 desktop (with Aero enabled) for a few minutes and record the wattage drawn from the wall via a power meter.Power Consumption (Idle)
Windows Aero enabled
- Raspberry Pi (claimed power consumption)
- Gigabyte BRIX S GB-BXi5H-5200 (Core i5-5200U)
- Intel NUC Kit NUC5i3RYK (Core i3-5010U)
- Intel NUC D54250WYK (Core i5-4250U)
- Intel NUC DC53427RKE
- Intel NUC D33217CK
- Intel Core i3-3220
-
- 4
-
-
9
-
-
-
9
-
-
-
9
-
-
-
11
-
-
-
13
-
-
-
46
-
0
10
20
30
40
50
Watts, lower is better
-
Stock Speed
Load Power Consumption
To generate a realistic load power consumption figure we load the CPU using Prime95's small FFT test, which mimics 100 percent load across all logical and physical cores.Power Consumption (Load)
Unigene Heaven and Prime 95
- Raspberry Pi (claimed power consumption)
- Intel NUC Kit NUC5i3RYK (Core i3-5010U)
- Intel NUC D54250WYK (Core i5-4250U)
- Gigabyte BRIX S GB-BXi5H-5200 (Core i5-5200U)
- Intel NUC D33217CK
- Intel NUC DC53427RKE
- Intel Core i3-3220
-
- 4
-
-
15
-
-
-
24
-
-
-
27
-
-
-
27
-
-
-
29
-
-
-
78
-
0
10
20
30
40
50
60
70
80
Watts, lower is better
-
Stock Speed
CrystalDiskMark Benchmark Results
Website: CrystalDiskMark
CrystalDiskMark is similar to AS SSD in its use of incompressible data files, although it does use a different data pattern. We report the read and write results of the sequential and 4KB random tests
CrystalDiskMark 4K Random read
1000MB test, single queue depth
- Overclockers UK Infin8 Nebula
- Gigabyte BRIX S GB-BXi5H-5200
-
-
43
-
158
-
-
-
26
-
100
-
0
25
50
75
100
125
150
175
MB/sec, higher is better
-
Read
-
Write
CrystalDiskMark Sequential
1000MB test
- Overclockers UK Infin8 Nebula
- Gigabyte BRIX S GB-BXi5H-5200
-
-
506
-
449
-
-
-
424
-
167
-
0
100
200
300
400
500
MB/sec, higher is better
-
Read
-
Write
PCMark 8 Storage tests
Website: Futuremark
We've selected two benchmarks from PCMark 8's array of storage tests - the Battlefield 3 and Heavy Photoshop storage traces. These mimic real-world usage, for instance, loading a game and entering a save game or performing image editing. The final result is given in seconds.
PCMark 8 Storage test - Battlefield 3
Game and save game storage trace
- Overclockers UK Infin8 Nebula
- Gigabyte BRIX S GB-BXi5H-5200
-
-
134
-
-
-
136
-
0
25
50
75
100
125
150
Seconds, lower is better
-
Trace time
PCMark 8 Storage test - Photoshop
Application storage trace (heavy test)
- Overclockers UK Infin8 Nebula
- Ambros Gigabyte BRIX S GB-BXi5H-5200
-
-
362
-
-
-
370
-
0
100
200
300
400
Seconds, lower is better
-
Trace time


Want to comment? Please log in.