Unigine Valley 1.0 Benchmark
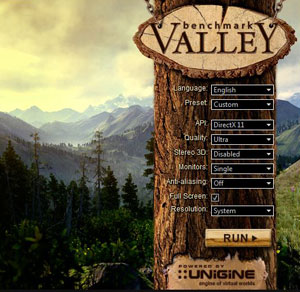
Publisher: UnigineWe've also updated our testing to include Unigine's free Valley 1.0 benchmarking tool. It works well as a graphics benchmark as it is GPU limited and is thus incredibly taxing on the GPU whilst placing the CPU under very little stress.
Until now, we've only run the full benchmark at 2,560 x 1,440. However, following feedback in our forums, we'll now be including Unigine Valley results at 1,920 x 1,080 too, using the same settings (fullscreen, AA off, Ultra detail). This means many more users can directly compare their results to ours, as 1080p is by far the more popular resolution. Unigine's scoring system is effectively linear: a card with 2,000 points is considered twice as fast as one with 1,000 points, and half as fast as one with 4,000 points. We'll be retesting and adding more cards to the 1080p chart in the near future.
Unigine Valley 1.0
1,920 x 1,080, 0x AA, 'Ultra' Quality
- AMD Radeon R9 295X2 8GB
- Nvidia GeForce GTX 780 3GB
- AMD Radeon R9 290X 4GB
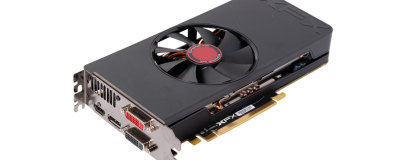
- XFX Radeon R7 265 Core Edition 2GB
- Nvidia GeForce GTX 750 Ti 2GB
-
-
5528
-
-
-
3919
-
-
-
3914
-
-
-
1647
-
-
-
1647
-
0
1000
2000
3000
4000
5000
6000
Score (higher is beter)
-
Score
Unigine Valley 1.0
2,560 x 1,440, 0x AA, 'Ultra' Quality
- AMD Radeon R9 295X2 8GB
- Nvidia GeForce GTX Titan Black 6GB
- Nvidia GeForce GTX 780 Ti 3GB
- Nvidia GeForce GTX 780 3GB
- AMD Radeon R9 290X 4GB
- AMD Radeon R9 290 4GB
- Nvidia GeForce GTX 770 2GB
- AMD Radeon R9 280X 3GB
- Nvidia GeForce GTX 760 2GB
- AMD Radeon R9 270X 2GB
- Nvidia GeForce GTX 660 2GB
- AMD Radeon R9 270 2GB
- Nvidia GeForce GTX 750 Ti 2GB
- XFX Radeon R7 265 Core Edition 2GB
- AMD Radeon R7 260X 2GB
-
-
4313
-
-
-
3000
-
-
-
2947
-
-
-
2487
-
-
-
2378
-
-
-
2210
-
-
-
2135
-
-
-
1760
-
-
-
1657
-
-
-
1284
-
-
-
1263
-
-
-
1148
-
-
-
981
-
-
-
967
-
-
-
846
-
0
1000
2000
3000
4000
Score (higher is beter)
-
Score


Want to comment? Please log in.