AMD Radeon R9 Fury X Review

June 24, 2015 | 12:59

Tags: #amd-radeon-r9-fury-x-review #fiji #r9-300-series #radeon-r9-fury-x

Companies: #amd

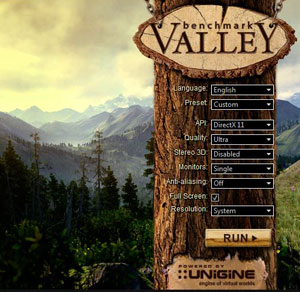
Unigine Valley 1.0 Benchmark

Publisher: Unigine

Unigine's free Valley 1.0 benchmarking tool works well as a graphics benchmark as it is GPU limited and is thus incredibly taxing on the GPU whilst placing the CPU under very little stress.

Unigine's scoring system is effectively linear: a card with 2,000 points is considered twice as fast as one with 1,000 points, and half as fast as one with 4,000 points. As such, you can easily replicate and run the test on your own system to gauge roughly how big a difference an upgrade would likely make for you. Currently, Nvidia hardware tends to fare much better than AMD's in this test, so it is mostly useful for comparing AMD cards with other AMD cards and likewise with Nvidia.

*AMD Radeon R9 Fury X Review **NDA WEDNESDAY 24/06 1PM** AMD Radeon R9 Fury X Review - Unigine Valley 1.0 *AMD Radeon R9 Fury X Review **NDA WEDNESDAY 24/06 1PM** AMD Radeon R9 Fury X Review - Unigine Valley 1.0

Unigine Valley 1.0

1,920 x 1,080, 'Ultra' Quality, 0x AA

  • Nvidia GeForce GTX 980 Ti 6GB
  • Nvidia GeForce GTX 980 4GB
  • AMD Radeon R9 Fury X 4GB
  • AMD Radeon R9 290X 4GB
    • 6145
    • 4992
    • 4971
    • 3914
0
1000
2000
3000
4000
5000
6000
Score (higher is beter)
  • Score

Unigine Valley 1.0

2,560 x 1,440, 'Ultra' Quality, 0x AA

  • Nvidia GeForce GTX 980 Ti 6GB
  • AMD Radeon R9 Fury X 4GB
  • Nvidia GeForce GTX 980 4GB
  • AMD Radeon R9 290X 4GB
    • 3963
    • 3283
    • 3088
    • 2443
0
1000
2000
3000
4000
Score (higher is beter)
  • Score

Discuss this in the forums
YouTube logo
MSI MPG Velox 100R Chassis Review

October 14 2021 | 15:04

TOP STORIES

SUGGESTED FOR YOU