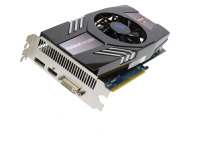
HIS ATI Radeon HD 5850 Review
Written by Harry Butler
October 14, 2009 | 09:41
Tags: #200 #5870 #crysis #fastest-graphics-card #graphics-card #hd-5850 #hd-5870 #new-ati-graphics-card #performance #radeon #review #tested #upgrade

Power Consumption (Idle and Gaming)
We tested the power consumption with a Watts Up? Pro power meter, using the device to record the total system power consumption at the wall socket, while we ran three sets of four runs of Crysis in DX10 at 1,920 x 1,200.Using the data recorded by the meter we could determine the peak output, the consistent minimum and the average load over the entire run of tests.
As both ATI and Nvidia test benches are now identical Core i7 systems, we can accurately determine the apples to apples difference of what power both PCs take to run.
Power Consumption (idle)
Windows Vista Desktop (Aero Enabled)
- ATI Radeon HD 5770 1GB
- ATI Radeon HD 5870 1GB
- Nvidia GeForce GTX 260-216 896MB
- Nvidia GeForce GTX 285 1GB
- HIS ATI Radeon HD 5850 1GB
- Nvidia GeForce GTX 275 896MB
- ATI Radeon HD 4850 512MB
- Nvidia GeForce 8800GT 512MB
- ATI Radeon HD 4890 1GB
- Nvidia GeForce GTX 295 1,792MB
- ATI Radeon HD 4870 1GB
- ATI Radeon HD 4870 X2 2GB
-
-
124
-
-
-
130
-
-
-
131
-
-
-
134
-
-
-
134
-
-
-
134
-
-
-
149
-
-
-
155
-
-
-
172
-
-
-
176
-
-
-
184
-
-
-
191
-
0
50
100
150
200
Power at socket (W)
-
Power Consumption (W)
Power Consumption (peak)
3DMark06 Canyon Flight test, 1,280 x 1,024 0xAA 16xAF, Peak Power Usage
- ATI Radeon HD 5770 1GB
- ATI Radeon HD 4850 512MB
- Nvidia GeForce 8800GT 512MB
- HIS ATI Radeon HD 5850 1GB
- Nvidia GeForce GTX 260-216 896MB
- ATI Radeon HD 4870 1GB
- ATI Radeon HD 5870 1GB
- ATI Radeon HD 4890 1GB
- Nvidia GeForce GTX 275 896MB
- Nvidia GeForce GTX 285 1GB
- Nvidia GeForce GTX 295 1,792MB
- ATI Radeon HD 4870 X2 2GB
-
-
213
-
-
-
223
-
-
-
235
-
-
-
238
-
-
-
255
-
-
-
262
-
-
-
268
-
-
-
271
-
-
-
297
-
-
-
301
-
-
-
375
-
-
-
415
-
0
100
200
300
400
Power at socket (W)
-
Power Consumption (W)
For analysis of these and all other results, please read the Results Analysis page.


Want to comment? Please log in.