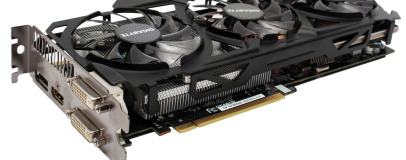
Gigabyte GeForce GTX 780 GHz Edition Review
Written by Matthew Lambert
March 14, 2014 | 10:11
Tags: #custom-cooler #factory-overclock #geforce #graphics-card #g-sync #gtx-780

Power Consumption (Idle and Gaming)
In order to get an idea of a GPU's power draw, we run our Unigine Valley 1.0 benchmark, which is our most GPU limited test. We use a watt meter to measure the maximum total system power draw during the test, and also take an idle reading at the Windows desktop (2,560 x 1,440).Power Consumption
Idle (Windows 7 Aero Desktop) and Load (Unigine Valley 1.0)
- Nvidia GeForce GTX 750 Ti 2GB
- AMD Radeon R7 260X 2GB
- Nvidia GeForce GTX 660 2GB
- AMD Radeon R9 270 2GB
- AMD Radeon R9 270X 2GB
- Nvidia GeForce GTX 760 2GB
- Nvidia GeForce GTX 770 2GB
- AMD Radeon R9 280X 3GB
- Nvidia GeForce GTX 780 3GB
- Nvidia GeForce GTX 780 Ti 3GB
- Nvidia GeForce GTX Titan Black 6GB
- AMD Radeon R9 290 4GB
- Sapphire Radeon R9 290X Tri-X OC 4GB
- AMD Radeon R9 290X 4GB
- Gigabyte GeForce GTX 780 GHz Edition 3GB
-
-
100
-
174
-
-
-
103
-
222
-
-
-
103
-
227
-
-
-
107
-
239
-
-
-
107
-
252
-
-
-
110
-
292
-
-
-
106
-
338
-
-
-
111
-
350
-
-
-
108
-
373
-
-
-
111
-
380
-
-
-
106
-
384
-
-
-
114
-
401
-
-
-
109
-
403
-
-
-
114
-
409
-
-
-
109
-
419
-
0
100
200
300
400
System Power Draw in Watts (lower is better)
-
Idle
-
Load
Thermal Performance (Idle and Gaming)
Thermal output is also measured using Unigine's Valley 1.0 benchmark, as its DirectX 11 features will stress all parts of a modern GPU. We leave all GPU fan profiles and settings as they come and leave the benchmark running for ten minutes so that temperatures plateau. We record the peak GPU temperature using GPU-Z, and present the data as the delta T (the difference between the GPU temperature and the ambient temperature in our labs). We also take an idle reading at the Windows desktop (2,560 x 1,440).Heat
Idle (Windows 7 Aero Desktop) and Load (Unigine Valley 1.0)
- Nvidia GeForce GTX 750 Ti 2GB
- Nvidia GeForce GTX 660 2GB
- Gigabyte GeForce GTX 780 GHz Edition 3GB
- AMD Radeon R9 270X 2GB
- Sapphire Radeon R9 290X Tri-X OC 4GB
- Nvidia GeForce GTX 770 2GB
- AMD Radeon R7 260X 2GB
- Nvidia GeForce GTX 760 2GB
- Nvidia GeForce GTX 780 3GB
- Nvidia GeForce GTX 780 Ti 3GB
- Nvidia GeForce GTX Titan Black 6GB
- AMD Radeon R9 290 4GB
- AMD Radeon R9 290X 4GB
-
- 5
-
41
-
-
9
-
41
-
-
-
10
-
47
-
-
-
8
-
50
-
-
-
12
-
52
-
-
-
10
-
55
-
-
-
8
-
56
-
-
- 7
-
57
-
-
10
-
59
-
-
-
14
-
59
-
-
-
9
-
61
-
-
-
19
-
72
-
-
-
19
-
72
-
0
10
20
30
40
50
60
70
80
Delta T in °C (lower is better)
-
Idle
-
Load
*As we do not have stock samples of the AMD Radeon R9 280X or AMD Radeon R9 270 they are not included in the thermal performance graphs


Want to comment? Please log in.