Power Consumption (Idle and Gaming)
Putting a realistic, repeatable load on a GPU to get a decent idea of its real world power consumption and thermal output has long been something with which we've experimented here at
bit-tech. We've found that synthetic benchmarks such as FurMark thrash the GPU constantly, which simply isn't reflective of how a GPU will be used when gaming.
It's such a hardcore test that any GPU under scrutiny is almost guaranteed to hit its thermal limit; the mark at which the card's firmware will kick in, speeding up the fan to keep the GPU within safe temperature limits. Conversely, simply leaving a game such as Crysis running at a certain point also isn't reflective of real-world use. There's no guarantee that the GPU is being pushed as hard as other titles might push it, and the load will vary between play-throughs.
We used to use the Canyon Flight test of 3DMark 06, as this was a punishing and repeatable test. However, we've now adopted
Unigine's Heaven 3.0 benchmark, as its DirectX 11 features will stress all the parts of a modern GPU. We use the default settings and a resolution of 2,560 x 1,600. We then hit the Benchmark button and watch the power draw from the wall between the grass field scene and the second dragon scene - this is the toughest portion of the test for both Nvidia and AMD hardware.
-
Nvidia GeForce GTX 660 2GB
-
Nvidia GeForce GTX 770 2GB
-
AMD Radeon HD 7850 2GB
-
Nvidia GeForce GTX 780 3GB
-
Nvidia GeForce GTX Titan 6GB
-
AMD Radeon HD 7870 2GB
-
Nvidia GeForce GTX 660 Ti 2GB
-
Nvidia GeForce GTX 760 2GB
-
AMD Radeon HD 7970 3GB GHz Edition
-
AMD Radeon HD 7950 3GB with Boost
-
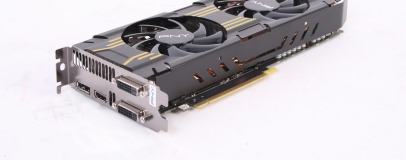
PNY GeForce GTX 770 XLR8 OC 2GB
-
Nvidia GeForce GTX 670 2GB
-
Nvidia GeForce GTX 680 2GB
-
Nvidia GeForce GTX 690 4GB
-
AMD Radeon HD 7990 6GB
-
103
-
104
-
106
-
108
-
108
-
108
-
109
-
110
-
110
-
110
-
110
-
111
-
112
-
122
-
127
System Power Consumption in Watts
-
AMD Radeon HD 7850 2GB
-
AMD Radeon HD 7870 2GB
-
Nvidia GeForce GTX 660 2GB
-
Nvidia GeForce GTX 660 Ti 2GB
-
Nvidia GeForce GTX 670 2GB
-
Nvidia GeForce GTX 760 2GB
-
Nvidia GeForce GTX 680 2GB
-
AMD Radeon HD 7950 3GB with Boost
-
Nvidia GeForce GTX 770 2GB
-
PNY GeForce GTX 770 XLR8 OC 2GB
-
Nvidia GeForce GTX 780 3GB
-
Nvidia GeForce GTX Titan 6GB
-
AMD Radeon HD 7970 3GB GHz Edition
-
Nvidia GeForce GTX 690 4GB
-
AMD Radeon HD 7990 6GB
-
227
-
243
-
244
-
266
-
277
-
295
-
300
-
314
-
333
-
341
-
344
-
352
-
356
-
415
-
470
System Power Consumption in Watts
Thermal Performance (Idle and Gaming)
We also have GPU-Z running in the background, and leave the Unigine benchmark running for ten minutes to record a peak GPU temperature. We present the temperature as a delta T (the difference between the temperature of the GPU and the ambient temperature in our labs).
-
AMD Radeon HD 7870 2GB
-
Nvidia GeForce GTX 770 2GB
-
Nvidia GeForce GTX 760 2GB
-
Nvidia GeForce GTX 660 2GB
-
Nvidia GeForce GTX Titan 6GB
-
Nvidia GeForce GTX 690 4GB
-
Nvidia GeForce GTX 780 3GB
-
Nvidia GeForce GTX 770 2GB
-
AMD Radeon HD 7970 3GB GHz Edition
-
Nvidia GeForce GTX 670 2GB
-
Nvidia GeForce GTX 680 2GB
-
Nvidia GeForce GTX 660 Ti
-
AMD Radeon HD 7990 6GB
-
AMD Radeon HD 7970 3GB
-
PNY GeForce GTX 770 XLR8 OC 2GB
-
AMD Radeon HD 7950 3GB with Boost
-
6
-
7
-
7
-
9
-
10
-
10
-
10
-
10
-
11
-
11
-
11
-
11
-
12
-
14
-
14
-
16
0
3
5.5
8
10.5
13
15.5
18
Delta T in °C
-
AMD Radeon HD 7870 2GB
-
Nvidia GeForce GTX 660 2GB
-
Nvidia GeForce GTX 660 Ti
-
AMD Radeon HD 7950 3GB with Boost
-
PNY GeForce GTX 770 XLR8 OC 2GB
-
AMD Radeon HD 7970 3GB
-
AMD Radeon HD 7990 6GB
-
Nvidia GeForce GTX 680 2GB
-
AMD Radeon HD 7970 3GB GHZ Editon
-
Nvidia GeForce GTX 670 2GB
-
Nvidia GeForce GTX 770 2GB
-
Nvidia GeForce GTX 760 2GB
-
AMD Radeon HD 7950 3GB
-
Nvidia GeForce GTX Titan 6GB
-
Nvidia GeForce GTX 780 3GB
-
Nvidia GeForce GTX 690 4GB
-
40
-
41
-
43
-
50
-
52
-
53
-
54
-
54
-
54
-
55
-
55
-
57
-
57
-
59
-
59
-
63
Delta T in °C
*as there's no stock model of the HD 7850 2GB, it is not included in these graphs


Want to comment? Please log in.