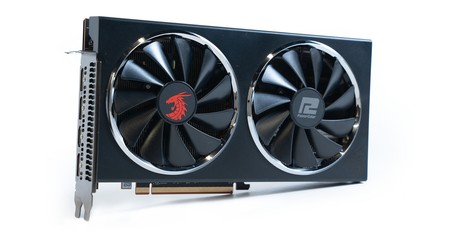
Performance Analysis
What Resolution?
In line with AMD’s marketing claims about being the ‘ultimate’ graphics card for 1080p, the PowerColor RX 5600 XT Red Dragon delivers solid results across the board at this resolution, averaging between 54fps and 113fps. In terms of the minimum or 99th percentile, our two most demanding games do see dips below 40fps, but we never saw any frame rates we’d consider unplayable. Our results show that even with the settings cranked you’ll get solid or excellent results at the most popular resolution.
The same isn’t true at 1440p, however. Less demanding and/or older games should run fine with so many pixels, as demonstrated by a 69fps minimum in Far Cry New Dawn, but we also have one sub-30fps result in Metro Exodus and one sub-25fps showing in Assassin’s Creed Odyssey. This demonstrates that 1440p is a resolution at which you can expect to run into problems sooner.
4K is a no-go for proper gaming, but that’s fair enough given the price point this card occupies.
Boosting Behaviour
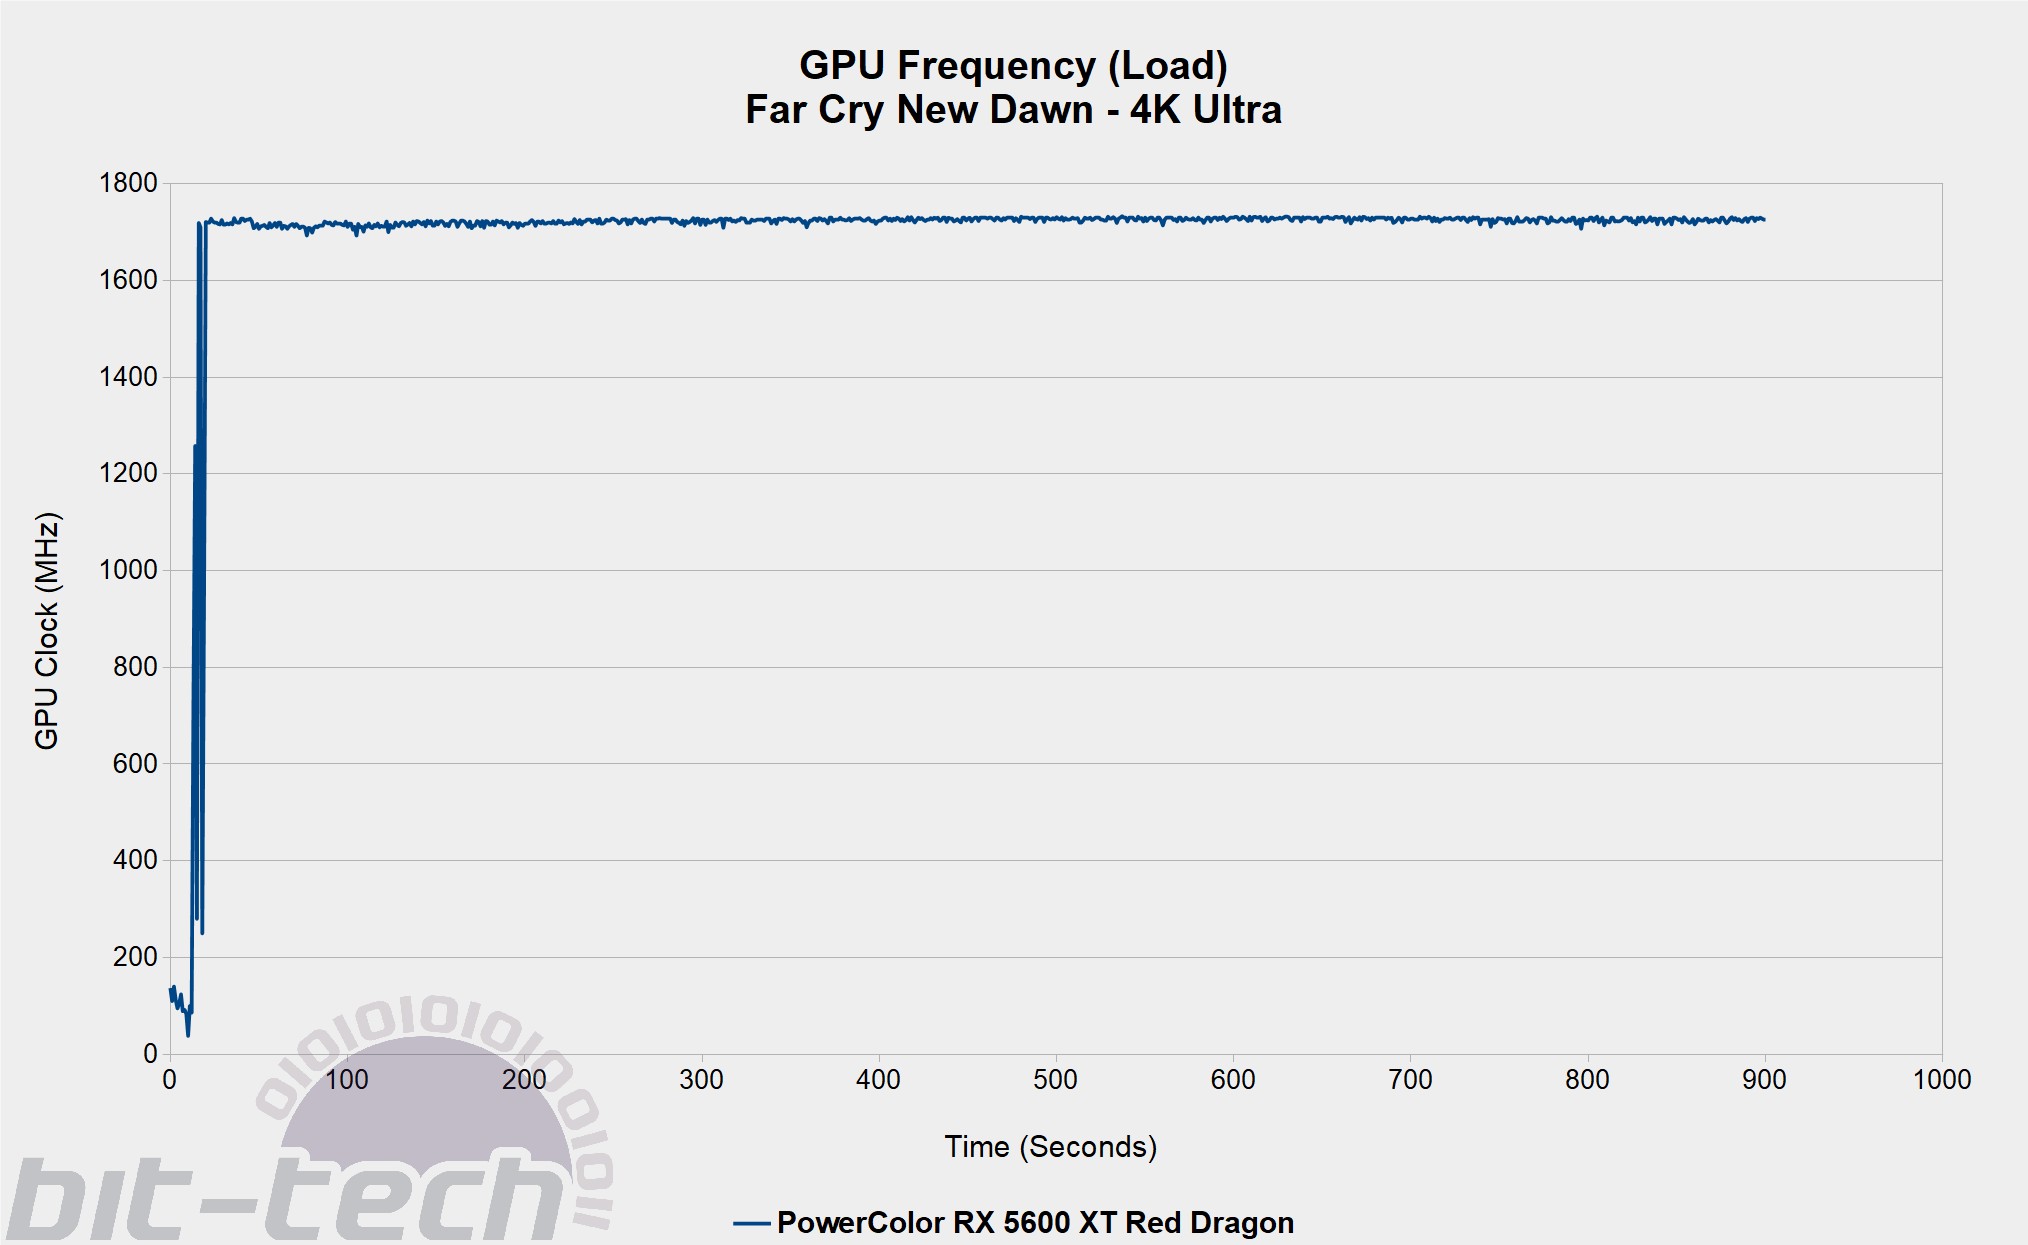
Boosting consistently to over 1,700MHz under load, the Red Dragon is aggressively tuned, as this comfortably surpasses both the game and boost clocks, which are listed as 1,560MHz and 1,620MHz respectively. We also do not see any of the high fluctuation that’s indicative of a power limit or a drop off as a result of thermal problems – kudos to PowerColor on both fronts.
It’s also worth mentioning that the memory was running at 14Gbps throughout testing and did not cause us any issues or instability.
Versus AMD Products
The closest card in AMD’s own stack in terms of specs and price is the RX 5700, and across the full set of game results, it’s 14.5 percent faster. That drops to 8.5 percent, however, when you focus only on 1080p, and increases to 17 and 18 percent respectively at 1440p and 4K. Those figures are skewed quite dramatically by Assassin’s Creed Odyssey, however, as the RX 5700 is faster in this game at both 1440p and 4K by nearly 60 percent on average, and the difference when comparing minimum frame rates is even more drastic. This suggests we’ve stumbled on a game that depends on more memory or memory bandwidth (or both) than the RX 5600 XT can offer.
Other games that are sensitive to the RX 5600 XT’s memory deficiencies are Total War: Three Kingdoms (mainly at 1440p and 4K) and Shadow of the Tomb Raider (even at 1080p). After all, the PowerColor card’s GPU is, aside from the L2 cache, identical to the RX 5700 in terms of functional units, and it even runs at very similar clocks to the reference RX 5700, so any differences we see between them are largely memory- or bandwidth-based, and these results we’ve just outlined are the ones where the difference is largest.
Versus Nvidia Products
With the RTX 2060 now occupying a lower price rung that sees mini-ITX cards available for as low as £270 and entry-level larger cards starting around £290, it’s a key comparison for this card. Obviously, as an RTX part, it offers support for real-time ray tracing effects in games, something AMD has no real answer to but which isn’t quite the holy grail Nvidia would have you believe, at least in the current state.
Overall, Nvidia’s card is six percent quicker in games, but this average disguises some intricacies. First up, the RTX 2060 dominates the RX 5600 XT in AC Odyssey at 1440p, averaging 48fps compared to just 31fps, and a similar difference is seen at 4K. Such a large difference again points to a memory/bandwidth deficiency for the AMD GPU, but what’s interesting is that the RTX 2060 has the same specs (6GB GDDR6, 3MB L2 cache, 192-bit interface, 14Gbps speed) as the PowerColor card, which seems to suggest that Nvidia’s driver or compression algorithm is doing a better job of managing the load. Shadow of the Tomb Raider at 4K also demonstrates a significant lead for the RTX card.
Of course, it’s 1080p that’s the most relevant resolution, and here Nvidia’s lead is only three percent. Game by game at this resolution, Nvidia takes victory in AC Odyssey, Shadow of the Tomb Raider, and Total War: Three Kingdoms, but AMD wins clearly in Far Cry New Dawn and Metro Exodus, and the two are level in The Division 2. In short, the two cards are close and trade blows depending on which architecture is best optimised for a given game, but our testing suggests that as memory and bandwidth demands increase long-term, Nvidia is in a better position to withstand them.
We unfortunately have no comparable data for lower end cards, so we’re unable to say how the RX 5600 XT compares to the GTX 1660 Ti, GTX 1660 Super, or RX 5500 XT.
Power, Thermals, Noise
Our measurements have the RTX 5600 XT consuming 15W less than the RTX 2060 under load, which is a decent showing given where the performance is. In terms of temperature, PowerColor’s cooler has things nicely under control. The delta T is on the high side, but there’s nothing wrong with having the GPU just below 75°C. The attention paid to cooling the memory modules and VRMs also pays off, as temperatures here were very healthy. PowerColor has also been conservative with the fan speed (which links to why the temperature appears a little high), as we observed a 27% fan speed under load, which equated to sub-1,000 RPM and a very pleasing audio profile.

MSI MPG Velox 100R Chassis Review
October 14 2021 | 15:04



Want to comment? Please log in.