Unigine Valley 1.0
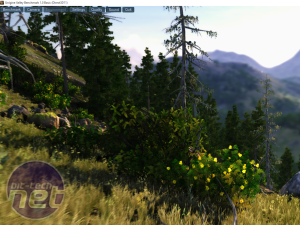
Publisher: UnigineUnigine's free Valley 1.0 benchmarking tool works well as a graphics benchmark as it is GPU-limited and is thus incredibly taxing on the GPU whilst placing the CPU under very little stress. Unigine's scoring system is effectively linear: a card with 2,000 points is considered twice as fast as one with 1,000 points, and half as fast as one with 4,000 points. As such, you can easily replicate and run the test on your own system to gauge roughly how big a difference an upgrade would likely make for you.


Power Consumption
For all of the performance tests, we disable all power-saving technology in order to give us a consistent set of results, and also best-case performance numbers - even though technologies such as Intel's SpeedStep might only take microseconds to kick in, that can make a difference in some tests.However, for the power consumption tests we re-enable everything in order to get a real-world power draw. The power draw is measured via a power meter at the wall, so the numbers below are of total system power draw from the mains, not the power consumption of a CPU itself. Measuring the power draw of any individual component in a PC is tricky to impossible to acheive.
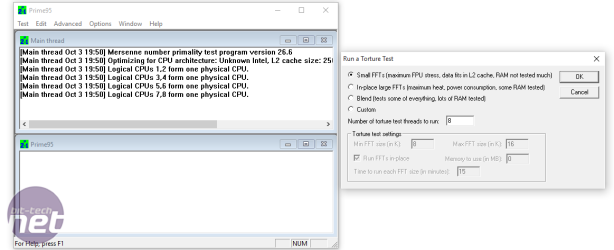
We use Prime95's smallFFT test to put the CPU under 100 percent load, while idle power results were taken with the PC sitting at a Windows Aero-enabled desktop.


MSI MPG Velox 100R Chassis Review
October 14 2021 | 15:04


Want to comment? Please log in.