Unigine Valley 1.0 Benchmark
Publisher: UnigineUnigine's free Valley 1.0 benchmarking tool works well as a graphics benchmark as it is GPU limited and is thus incredibly taxing on the GPU whilst placing the CPU under very little stress. Unigine's scoring system is effectively linear: a card with 2,000 points is considered twice as fast as one with 1,000 points, and half as fast as one with 4,000 points. We ran the test at 1,920 x 1,080 with 0 x AA and Ultra detail settings.
Cinebench R15 64-bit
Download from: www.maxon.netCinebench uses Maxon's Cinema 4D engine to render a photo-realistic scene of some shiny balls and weird things (we miss the motorbike). The scene is highly complex, with reflections, ambient occlusion and procedural shaders so it gives a CPU a tough workout. As Cinema 4D is a real-world application - used on films such as Spider-Man and Star Wars - Cinebench can be viewed as a real-world benchmark.
Battery Life
We completed three separate tests to assess battery life. Firstly, we ran Unigine Valley's benchmark continuously to stimulate a lengthy gaming session. This was performed at half brightness with WiFi enabled and the maximum performance mode enabled in Windows 8.1.The next test was using PCMark 8's Coventional Battery Test. This simulates using web browsers, spreadsheets and other light non-gaming tasks that should give you an idea of how long the battery will last under typical conditions. For this test, we reduced brightness to minimum, the power setting to Power Saver mode, but left WiFi enabled.
Our final test was an idle test to ascertain the maximum expected battery life. We used the Power Saver power setting, reduced the screen brightness to minimum, disabled WiFi and let the laptop run at idle. We also disabled sleep mode and prevented the screen from switching off.
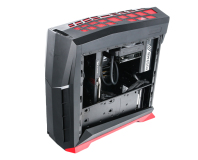


MSI MPG Velox 100R Chassis Review
October 14 2021 | 15:04

Want to comment? Please log in.