MSI X99A Tomahawk Review
Written by Antony Leather
November 23, 2016 | 13:32
Tags: #best-2011-board #best-2011-v3-board #best-broadwell-e-motherboard #best-x99-board #broadwell-e #haswell-e #lga2011 #lga2011-v3 #x99
Companies: #msi
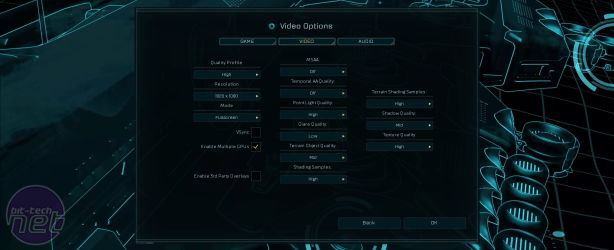
Ashes of the Singularity
Publisher: StardockWe use the built-in benchmark of Ashes of the Singularity, which runs through an automatic play-through scene in the game. We've selected the CPU-intensive benchmark option and used high settings with MSAA disabled abd also ticked the option for multi GPU support, all of which are located in the game's video options and benchmark menus. On startup we also select the DirectX 12 version, which is only available to use in Windows 10. We use a 30 second Fraps benchmark to obtain the minimum and average frame rate during the benchmark, beginning at the start.
Ashes of the Singularity
1,920 x 1,080, DX12, 'Medium' settings, CPU benchmark
- Asus X99-Deluxe II (Overclocked)
- Asus Rampage V Edition 10 (Overclocked)
- MSI X99A Tomahawk (Overclocked)
- MSI X99A Gaming Pro Carbon (Overclocked)
- Asus ROG Strix X99 Gaming (Overclocked)
- Gigabyte X99-Ultra Gaming (Overclocked)
- Gigabyte GA-X99-Designare EX Asus Rampage V Edition 10
- MSI X99A XPower Titanium (Overclocked)
- Asus Rampage V Edition 10 (Stock)
- Asus X99-Deluxe II (Stock)
- MSI X99A Tomahawk (Stock)
- Gigabyte X99-Ultra Gaming (Stock)
- Gigabyte GA-X99-Designare EX (Stock)
- Asus ROG Strix X99 Gaming (Stock)
- MSI X99A Gaming Pro Carbon (Stock)
-
-
38
-
43
-
-
-
38
-
42
-
-
-
37
-
41
-
-
-
37
-
41
-
-
-
37
-
41
-
-
-
37
-
40
-
-
-
37
-
40
-
-
-
37
-
40
-
-
-
36
-
40
-
-
-
36
-
40
-
-
-
36
-
39
-
-
-
36
-
39
-
-
-
36
-
39
-
-
-
36
-
39
-
-
-
35
-
38
-
0
10
20
30
40
Frames Per Second
-
Minimum
-
Average
Unigine Valley 1.0
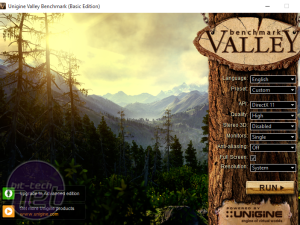
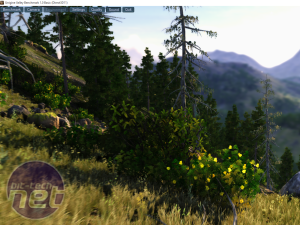
Publisher: UnigineUnigine's free Valley 1.0 benchmarking tool works well as a graphics benchmark as it is GPU-limited and is thus incredibly taxing on the GPU whilst placing the CPU under very little stress. Unigine's scoring system is effectively linear: a card with 2,000 points is considered twice as fast as one with 1,000 points, and half as fast as one with 4,000 points. As such, you can easily replicate and run the test on your own system to gauge roughly how big a difference an upgrade would likely make for you.
Unigine Valley
1,920 x 1,080, 'High' settings
- Asus X99-Deluxe II
- Gigabyte X99-Ultra Gaming
- MSI X99A XPower Titanium
- MSI X99A Tomahawk
- Asus Rampage V Edition 10
- Asus ROG Strix X99 Gaming
- MSI X99A Gaming Pro Carbon
- Gigabyte GA-X99-Designare EX
-
-
4010
-
6347
-
-
-
3967
-
6333
-
-
-
3937
-
6097
-
-
-
3909
-
6117
-
-
-
3902
-
6204
-
-
-
3894
-
6310
-
-
-
3867
-
5792
-
-
-
3783
-
6234
-
0
1000
2000
3000
4000
5000
6000
7000
Score (Higher Is Better)
-
Stock
-
Overclocked
3DMark Fire Strike
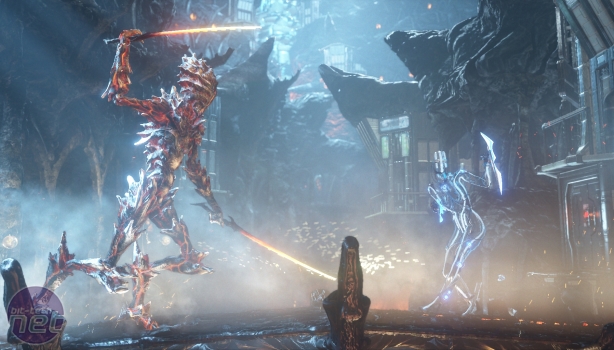
Publisher: FuturemarkFire Strike is a showcase DirectX 11 benchmark designed for today's high-performance gaming PCs. It is 3DMark's most ambitious and technical benchmark ever, featuring real-time graphics rendered with detail and complexity far beyond what is found in other benchmarks and games today.
3DMark Fire Strike
Overall score
- Asus X99-Deluxe II
- Gigabyte X99-Ultra Gaming
- Asus Rampage V Edition 10
- Gigabyte GA-X99-Designare EX
- MSI X99A XPower Titanium
- Asus ROG Strix X99 Gaming
- MSI X99A Tomahawk
- MSI X99A Gaming Pro Carbon
-
-
20142
-
20550
-
-
-
20010
-
20555
-
-
-
20003
-
20440
-
-
-
19775
-
20566
-
-
-
19149
-
20640
-
-
-
19135
-
20522
-
-
-
19019
-
20511
-
-
-
18998
-
15012
-
0
5000
10000
15000
20000
Score (Higher is Better)
-
Stock
-
Overclocked



Want to comment? Please log in.