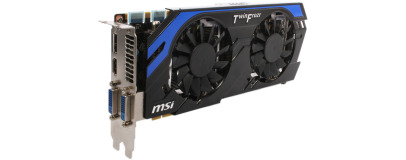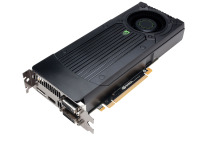
Power Consumption (Idle and Gaming)
Putting a realistic, repeatable load on a GPU to get a decent idea of its real world power consumption and thermal output has long been something with which we've experimented here at bit-tech. We've found that synthetic benchmarks such as FurMark thrash the GPU constantly, which simply isn't reflective of how a GPU will be used when gaming.
It's such a hardcore test that any GPU under scrutiny is almost guaranteed to hit its thermal limit; the mark at which the card's firmware will kick in, speeding up the fan to keep the GPU within safe temperature limits. Conversely, simply leaving a game such as Crysis running at a certain point also isn't reflective of real-world use. There's no guarantee that the GPU is being pushed as hard as other titles might push it, and the load will vary between play-throughs.
We used to use the Canyon Flight test of 3DMark 06, as this was a punishing and repeatable test. However, we've now adopted Unigine's Heaven 2.5 benchmark, as its DirectX 11 features will stress all the parts of a modern GPU. We use the default settings and a resolution of 1,920 x 1,080. We also check that 4x AA and 4x AF are enabled and that tessellation is set to Standard. We then hit the Benchmark button and watch the power draw from the wall between the grass field scene and the second dragon scene - this is the toughest portion of the test for both Nvidia and AMD hardware.
We also have GPU-Z running in the background, and leave the Unigine benchmark running for ten minutes to record a peak GPU temperature. We present the temperature as a delta T (the difference between the temperature of the GPU and the ambient temperature in our labs).
Thermal Performance
*as there's no stock model of the HD 7850 2GB, it is not included in these graphs
Read our performance analysis.

MSI MPG Velox 100R Chassis Review
October 14 2021 | 15:04


Want to comment? Please log in.