How We Test Power Supplies
Unfortunately, even closely scrutinising the label won't tell you anything about voltage stability, which is probably the most important factor in a PSU. Producing a stable voltage on each rail is a pretty tough task, and some PSUs simply aren't up to the job. Voltage stability is important, as some components may not start up if the voltage is too low, or could burn out if the voltage is too high. You certainly don't want to risk damaging your new CPU or graphics card, just because you bought a nefariously labelled PSU.Fortunately, the Intel ATX spec, which you'll find at www.formfactors.org, lays down the physical and electrical characteristics necessary to adhere to the spec in black and white.
The ATX spec cites that there can be a maximum of 5 per cent variance (above or below) the voltage on the 3.3V, 5V and 5VSB rails, and up to 10 per cent variance on the -12V rail. For the 12V rails, the voltage can vary by up to 5 per cent.
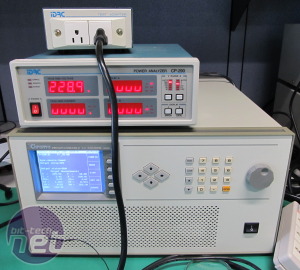
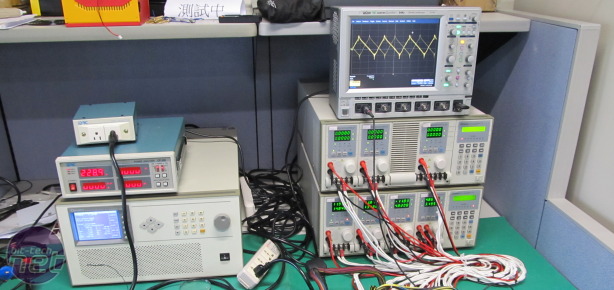
As PSU test equipment is highly specialised, we use a third-party lab - in this case, the R&D office of Antec out in Taiwan. This enables us to use the latest generation of PSU testing equipment. By using a combination of a Chroma 6314 load tester, Chroma 61604 programmable power source and iDRC CP-290 power meter, we're able to measure the voltage stability, overall efficiency and PFC efficiency of each PSU.
To test each PSU, we programmed the load testers to drain the amount of power that each manufacturer claims its PSU can deliver. The voltage of each rail was measured at 10, 50 and 100 per cent load to determine if it was within the ATX spec. We then left each PSU running at 100 per cent load for 15 minutes to see if it could produce stable voltages over an extended period.
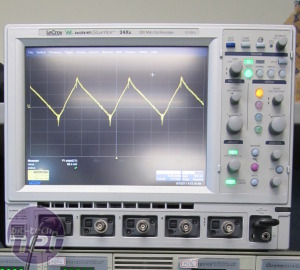
We've also added two new tests to our suite, thanks to the presence of a LeCroy WaveSurfer oscilloscope in Antec's lab. The ripple test is a measurement of the peak-to-peak difference in the amplitude of the 12V voltage waveform supplied by the PSU. All PSUs exhibit ripple to some extent, but we'll be favouring results with the lowest values, as high ripple can potentially shorten the lifespan of your components. As a point of reference, the ATX specification states 120mV for the maximum recommended ripple.
We're also now able to measure the hold-up time of the 5V and 12V rails. Hold-up is the length of time a PSU is able to supply power, taking into account small dropouts in the power supplied by the mains. These troughs only last for fractions of a second but can cause issues, so the PSU steps in and takes up the slack. The ATX specification recommends a minimum hold-up time of 17ms.


Left: Chroma 61604 programmable power source and iDRC CP-290 power meter. Right: LeCroy WaveSurfer oscilloscope. Click to enlarge
Meanwhile, an area of increasing interest is the overall efficiency of the PSU or, in other words, how much power it requires from the mains to produce the requested load. Efficiency is very important; in a manner similar to that of an internal combustion engine, any wasted energy is dissipated as heat, which the cooling system has to expel. If it doesn't do this well, the effectiveness of the electronic components inside the PSU will be reduced, or the PSU will burn out.
For example, many PSUs are only rated as being capable of providing their claimed output at a temperature between 25°C and 40°C, and their output will drop above this level. This means that a less efficient PSU will require a more powerful and noisy cooling system. An efficient PSU, on the other hand, will run cooler and draw less power from the mains, which will help to reduce your electricity bill. The ATX spec cites that, at full load, a PSU has to be at least 70 per cent efficient.
It's also important to test the efficiency of the Power Factor Correction (PFC) circuitry of a PSU. The PFC helps to reduce uneven harmonics in the incoming current, which then helps to reduce the PSU's power consumption.
The Scores
Although there were several hundred test measurements to analyse, the process was made slightly easier by using the ATX spec as a guide.The voltage stability tests take pride of place in the scoring box and account for 40 per cent of each PSU's overall score. The scores shown are the number of test measurements that are within the limits of the ATX spec, converted into a percentage to enable PSUs with a different number of rails to be compared. We only recommend that you buy a PSU that has 100 per cent stability.
Meanwhile, the Design score includes the overall efficiency and PFC efficiency as measured during the 50 and 100 per cent load test scenarios, the number, type and quality of the cables, plus the noise of the cooling fan(s) at 100 per cent load. The Design score also incorporates how little ripple we measured, and the length of the hold-up time.
Finally, the Value score is a combination of the Stability and Features scores and the total output (in watts) divided by the price. These three scores are then added together to give the Overall score of the PSU.

MSI MPG Velox 100R Chassis Review
October 14 2021 | 15:04


Want to comment? Please log in.