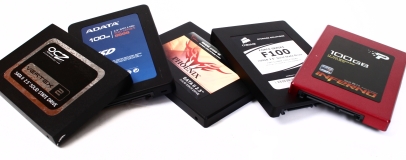
ATTO Disk Benchmark Results
Website: ATTO Disk BenchmarkWith Window 7's improved caching technology, our traditional sequential read/write benchmark, FC -Test, was no longer practical, due to data being immediately cached and thus invalidating our copy and read performance figures.
Instead then we've opted for ATTO disk benchmark as a straight forward but surprisingly popular tool for testing a hard disk or SSD's ability to deal with reading and writing files of various sizes. The benchmark sequentially writes and reads files from 0.5KB to 8MB and can also be adjusted for overlapped I/O and a variety of queue depths, although we've tested using the benchmark's default settings, recording 1024KB performance.
TRIM is essential for an SSD to maintain its performance. To test whether a drive supports TRIM well or not, we fill and empty each drive mercilessly, writing and then deleting over 500GB of data before emptying the Recycle Bin to trigger the TRIM command. we waited five minutes for each drive to clear its decks. If the drive supports TRIM perfectly, there should be no performance drop-off shown in the lighter tone bars.

MSI MPG Velox 100R Chassis Review
October 14 2021 | 15:04


Want to comment? Please log in.