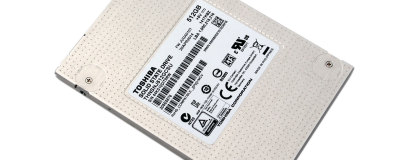
CrystalDiskMark Benchmark Results
Website: CrystalDiskMarkCrystalDiskMark is similar to AS SSD in its use of incompressible data files, although it does use a different data pattern. We report the read and write results of the sequential and 4KB random tests
Sequential Performance
CrystalDiskMark 1,000MB
Incompressible Data, 1,000MB Sequential Read
- Samsung SSD 840 Evo 1TB (Rapid Mode)
- Samsung SSD 840 Pro 256GB
- Toshiba HG6 SSD 512GB
- Samsung SSD 840 Evo 250GB
- Samsung SSD 840 Evo 500GB
- Corsair Neutron GTX 240GB
- OCZ Vector 150 240GB
- Crucial M550 512GB
- SanDisk Ultra Plus 256GB
- Crucial MX100 512GB
- OCZ Vertex 450 256GB
- Intel SSD 730 240GB
-
-
872
-
-
-
544
-
-
-
541
-
-
-
539
-
-
-
537
-
-
-
530
-
-
-
526
-
-
-
524
-
-
-
523
-
-
-
517
-
-
-
513
-
-
-
478
-
0
100
200
300
400
500
600
700
800
900
MB/sec, Higher Is Better
-
Average Read Speed
CrystalDiskMark 1,000MB
Incompressible Data, 1,000MB Sequential Write
- Samsung SSD 840 Evo 1TB (Rapid Mode)
- Samsung SSD 840 Evo 500GB
- Samsung SSD 840 Pro 256GB
- Samsung SSD 840 Evo 250GB
- OCZ Vertex 450 256GB
- OCZ Vector 150 240GB
- Toshiba HG6 SSD 512GB
- Crucial M550 512GB
- Crucial MX100 512GB
- Corsair Neutron GTX 240GB
- SanDisk Ultra Plus 256GB
- Intel SSD 730 240GB
-
-
1060
-
-
-
525
-
-
-
525
-
-
-
520
-
-
-
518
-
-
-
517
-
-
-
510
-
-
-
503
-
-
-
502
-
-
-
456
-
-
-
448
-
-
-
288
-
0
250
500
750
1000
MB/sec, Higher Is Better
-
Average Write Speed
Random Performance
CrystalDiskMark 1,000MB
Incompressible Data, 4K Random Read, Single QD
- Samsung SSD 840 Evo 1TB (Rapid Mode)
- Samsung SSD 840 Evo 500GB
- Samsung SSD 840 Evo 250GB
- Samsung SSD 840 Pro 256GB
- Intel SSD 730 240GB
- SanDisk Ultra Plus 256GB
- Crucial MX100 512GB
- Crucial M550 512GB
- Corsair Neutron GTX 240GB
- OCZ Vector 150 240GB
- Toshiba HG6 SSD 512GB
- OCZ Vertex 450 256GB
-
-
76.67
-
-
-
44.44
-
-
-
41.23
-
-
-
38.61
-
-
-
37.80
-
-
-
36.56
-
-
-
33.18
-
-
-
32.67
-
-
-
30.72
-
-
-
26.83
-
-
-
24.66
-
-
-
24.64
-
0
10
20
30
40
50
60
70
80
MB/sec, Higher Is Better
-
Average Random Read Speed
CrystalDiskMark 1,000MB
Incompressible Data, 4K Random Write, Single QD
- Samsung SSD 840 Evo 1TB (Rapid Mode)
- OCZ Vector 150 240GB
- OCZ Vertex 450 256GB
- Crucial MX100 512GB
- Crucial M550 512GB
- Samsung SSD 840 Pro 256GB
- Samsung SSD 840 Evo 500GB
- Samsung SSD 840 Evo 250GB
- Intel SSD 730 240GB
- Toshiba HG6 SSD 512GB
- Corsair Neutron 240GB
- SanDisk Ultra Plus 256GB
-
-
337.30
-
-
-
131.90
-
-
-
129.60
-
-
-
128.70
-
-
-
128.30
-
-
-
120.10
-
-
-
119.70
-
-
-
119.40
-
-
-
118.20
-
-
-
114.90
-
-
-
110.50
-
-
-
109.80
-
0
50
100
150
200
250
300
350
MB/sec, Higher Is Better
-
Average Random Write Speed
CrystalDiskMark 1,000MB
Incompressible Data, 4K Random Read, 32 QD
- Samsung SSD 840 Pro 256GB
- Crucial M550 512GB
- Samsung SSD 840 Evo 1TB (Rapid Mode)
- Samsung SSD 840 Evo 500GB
- Samsung SSD 840 Evo 250GB
- Corsair Neutron GTX 240GB
- Toshiba HG6 SSD 512GB
- Intel SSD 730 240GB
- OCZ Vector 150 240GB
- OCZ Vertex 450 256GB
- Crucial MX100 512GB
- SanDisk Ultra Plus 256GB
-
-
407
-
-
-
406
-
-
-
405
-
-
-
405
-
-
-
401
-
-
-
391
-
-
-
387
-
-
-
372
-
-
-
361
-
-
-
348
-
-
-
339
-
-
-
336
-
0
100
200
300
400
MB/sec, Higher Is Better
-
Average Random Read Speed
CrystalDiskMark 1,000MB
Incompressible Data, 4K Random Write, 32 QD
- Samsung SSD 840 Evo 1TB (Rapid Mode)
- OCZ Vector 150 240GB
- OCZ Vertex 450 256GB
- Samsung SSD 840 Evo 500GB
- Samsung SSD 840 Pro 256GB
- Crucial M550 512GB
- Crucial MX100 512GB
- Corsair Neutron GTX 240GB
- Samsung SSD 840 Evo 250GB
- Intel SSD 730 240GB
- Toshiba HG6 SSD 512GB
- SanDisk Ultra Plus 256GB
-
-
700
-
-
-
374
-
-
-
372
-
-
-
372
-
-
-
371
-
-
-
367
-
-
-
366
-
-
-
346
-
-
-
312
-
-
-
287
-
-
-
262
-
-
-
180
-
0
100
200
300
400
500
600
700
MB/sec, Higher Is Better
-
Average Random Write Speed


Want to comment? Please log in.