We've found the best way to test the impact of water-cooling is a dual loop of Unigine's Valley benchmark, which loads the GPU for an extended period not possible in our normal game benchmarks. In short, loading it for anything less than two minutes is not likely to see the thermals peak and throttling revealed at its fullest extent. We ran Unigine's Valley benchmark with 8x AA, Ultra settings and a resolution of 1,920 x 1,200.
This mimics extended gaming sessions except with repeatable results, showing how much performance you could be losing (or gaining) with the stock cooler versus custom liquid cooling.
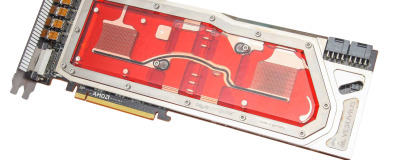
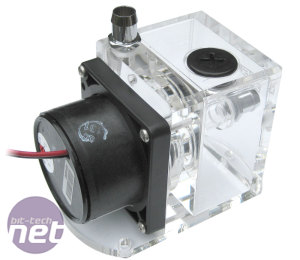
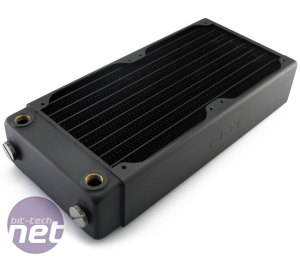
The core hardware consisted of an Asus Maximus VI Formula and Core i7-4770K overclocked to 4.5GHz, along with 16GB Corsair Vengeance 2,400MHz RAM and a Corsair AX860i PSU. For the water-cooling, we've used a Laing D5 with an XSPC Acrylic D5 Tank Reservoir, an XSPC RX 240 radiator, 2 x XSPC 1650rpm 120mm fans, 13/10mm fittings and tubing and, of course, the Aqua Computer Kryographics Vesuvius 295 X2 Acrylic Edition waterblock.

MSI MPG Velox 100R Chassis Review
October 14 2021 | 15:04


Want to comment? Please log in.