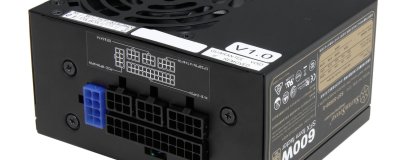
SilverStone SX600-G 600W PSU Review
Written by bit-tech Staff
January 16, 2015 | 12:34
Tags: #sfx-psu
Companies: #silverstone

Efficiency
Each PSU's efficiency is calculated by dividing the power it outputs by the power it uses to do so. Starting at 100W load, we test in 100W load increments up to an including the maximum rated wattage. While the average efficiency of all the load tests is what's considered for the scoring, the results and rankings of the individual load intervals are also displayed below.Average Efficiency
Mean efficiency across load tests 100W+
- Antec EDGE 650W
- SilverStone SX600-G 600W
-
89.99
-
89.86
0
10
20
30
40
50
60
70
80
90
Percentage (higher is better)
Efficiency
100W load test
- SilverStone SX600-G 600W
- Antec EDGE 650W
-
87.40
-
86.50
0
10
20
30
40
50
60
70
80
90
Percentage (higher is better)
Efficiency
200W load test
- Antec EDGE 650W
- SilverStone SX600-G 600W
-
91.06
-
90.60
0
25
50
75
100
Percentage (higher is better)
Efficiency
300W load test
- Antec EDGE 650W
- SilverStone SX600-G 600W
-
91.32
-
91.24
0
25
50
75
100
Percentage (higher is better)
Efficiency
400W load test
- Antec EDGE 650W
- SilverStone SX600-G 600W
-
91.10
-
90.55
0
25
50
75
100
Percentage (higher is better)
Efficiency
500W load test
- Antec EDGE 650W
- SilverStone SX600-G 600W
-
90.50
-
90.01
0
25
50
75
100
Percentage (higher is better)
Efficiency
600W load test
- Antec EDGE 650W
- SilverStone SX600-G 600W
-
89.96
-
89.35
0
10
20
30
40
50
60
70
80
90
Percentage (higher is better)
Efficiency
Max. load test
- Antec EDGE 650W
- SilverStone SX600-G 600W
-
89.51
-
89.35
0
10
20
30
40
50
60
70
80
90
Percentage (higher is better)


Want to comment? Please log in.