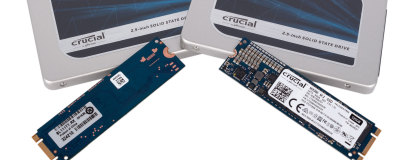
Crucial MX300 and MX300 M.2 Reviews (525GB & 1TB)
Written by Matthew Lambert
January 13, 2017 | 12:03

Iometer (Steady State and Consistency Performance)
Website: www.iometer.orgFollowing our fresh out of the box testing, we then fill the drive with multiple game installs to within 1GB of its maximum capacity. Then, using Iometer, we begin a full one hour test of random 4KB writes at a queue depth of 32. This quickly fills up the rest of the drive's spare area, and then forces it into a simulated steady state, where the controller is having to process the incoming writes while also managing the resultant NAND fragmentation and performing garbage collection to make free blocks available to write to, all without any idle time.
This test puts the controller under far more stress than any client workload would, and is most relevant to those looking to use drives in intensive workstation or server environments, for example. In such situations it's important for a drive to maintain high performance and stay responsive, so we report here the average IOPS and average response time from the last five minutes of the one hour test.
Iometer - Steady State 4KB Random Write QD32
Average IOPS from last five minutes
- Intel SSD 750 Series 1.2TB (AIC)
- OCZ Arc 100 240GB
- Crucial MX300 M.2 1TB
- Samsung SSD 950 PRO 512GB
- Toshiba OCZ RD400 512GB
- Samsung SSD 850 PRO 256GB
- Crucial MX300 M.2 525GB
- Samsung SSD 950 PRO 256GB
- Crucial MX300 525GB
- Crucial BX100 500GB
- SK Hynix Canvas SC300 256GB
- OCZ Trion 100 480GB
- Plextor M6V 256GB
- OCZ Trion 100 960GB
- OCZ Trion 100 240GB
- Crucial BX200 480GB
- Crucial BX200 960GB
-
-
24188
-
-
-
19364
-
-
-
11379
-
-
-
11273
-
-
-
10850
-
-
-
8734
-
-
-
7941
-
-
-
7170
-
-
-
7001
-
-
-
6952
-
-
-
5961
-
-
-
3554
-
-
-
3209
-
-
-
3017
-
-
-
2704
-
-
- 2359
-
- 1817
0
5000
10000
15000
20000
25000
IOPS (higher is better)
-
Average IOPS
Iometer - Steady State 4KB Random Write QD32
Average response time from last five minutes
- Intel SSD 750 Series 1.2TB (AIC)
- OCZ Arc 100 240GB
- Samsung SSD 950 PRO 512GB
- Crucial MX300 M.2 1TB
- Toshiba OCZ RD400 512GB
- Samsung SSD 850 PRO 256GB
- Crucial MX300 M.2 525GB
- Samsung SSD 950 PRO 256GB
- Crucial MX300 525GB
- SK Hynix Canvas SC300 256GB
- Crucial BX100 500GB
- Plextor M6V 256GB
- OCZ Trion 100 480GB
- OCZ Trion 100 240GB
- OCZ Trion 100 960GB
- Crucial BX200 480GB
- Crucial BX200 960GB
-
- 1.32
-
- 1.93
-
- 2.84
-
- 2.93
-
- 3.07
-
- 3.66
-
- 4.21
-
- 4.47
-
- 4.73
-
-
5.72
-
-
-
9.97
-
-
-
15.27
-
-
-
18.31
-
-
-
18.94
-
-
-
24.39
-
-
-
46.87
-
-
-
56.34
-
0
10
20
30
40
50
60
Miliseconds (lower is better)
-
Average Response Time
Average performance is only one side of the coin, however. It's also important to consider consistency i.e. how varied performance is under sustained load. A drive with more consistent performance has more robust algorithms for NAND defragmentation, page mapping, garbage collection and so on. To measure consistency, we calculate the standard deviation of the IOPS readings, again from the last five minutes where the drive is in its most steady state. Again, these figures are typically more relevant for enterprise users, but power users at home who do lots of multitasking, especially with write-intensive workloads, will benefit from having performance that is both fast and consistent – it reduces the prevalence of hiccups and stutters, especially as the drive becomes more full and worn over time.
The last graph shows IOPS divided by the standard deviation. This will help highlight the best drives i.e. those that can maintain high performance in a consistent fashion.
Iometer - Steady State 4KB Random Write QD32
Standard deviation of IOPS from last five minutes
- Samsung SSD 850 PRO 256GB
- Samsung SSD 950 PRO 256GB
- Samsung SSD 950 PRO 512GB
- Intel SSD 750 Series 1.2TB (AIC)
- Crucial MX300 525GB
- SK Hynix Canvas SC300 256GB
- Crucial MX300 M.2 525GB
- Toshiba OCZ RD400 512GB
- Crucial MX300 M.2 1TB
- OCZ Trion 100 240GB
- Plextor M6V 256GB
- Crucial BX200 960GB
- Crucial BX200 480GB
- OCZ Arc 100 240GB
- OCZ Trion 100 480GB
- OCZ Trion 100 960GB
- Crucial BX100 500GB
-
- 133
-
- 189
-
- 228
-
- 516
-
-
1409
-
-
-
1591
-
-
-
1714
-
-
-
1939
-
-
-
2276
-
-
-
3413
-
-
-
3749
-
-
-
4333
-
-
-
5107
-
-
-
5112
-
-
-
6547
-
-
-
6679
-
-
-
12546
-
0
2500
5000
7500
10000
12500
Standard Deviation (lower is better)
-
Standard Deviation
Iometer - Steady State 4KB Random Write QD32
Average IOPS divided by standard deviation from last five minutes
- Samsung SSD 850 PRO 256GB
- Samsung SSD 950 PRO 512GB
- Intel SSD 750 Series 1.2TB (AIC)
- Samsung SSD 950 PRO 256GB
- Toshiba OCZ RD400 512GB
- Crucial MX300 M.2 1TB
- Crucial MX300 525GB
- Crucial MX300 M.2 525GB
- OCZ Arc 100 240GB
- SK Hynix Canvas SC300 256GB
- Plextor M6V 256GB
- OCZ Trion 100 240GB
- Crucial BX100 500GB
- OCZ Trion 100 480GB
- Crucial BX200 480GB
- OCZ Trion 100 960GB
- Crucial BX200 960GB
-
-
65.85
-
-
-
49.38
-
-
-
46.87
-
-
-
37.90
-
-
- 5.60
-
- 5.00
-
- 4.97
-
- 4.63
-
- 3.79
-
- 3.75
-
- 0.86
-
- 0.79
-
- 0.55
-
- 0.54
-
- 0.46
-
- 0.45
-
- 0.42
0
10
20
30
40
50
60
70
Higher is better
-
IOPS over Standard Deviation


Want to comment? Please log in.