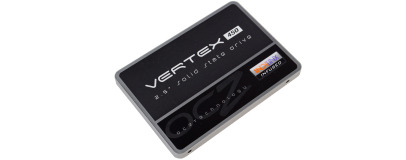
OCZ Vertex 450 256GB Review
Written by Matthew Lambert
September 26, 2013 | 09:41
Tags: #20nm #acronis #barefoot-3 #imft #mlc #nand #ssd #vector #vertex

CrystalDiskMark Benchmark Results
Website: CrystalDiskMarkWe've chosen to drop ATTO Disk benchmark from our SSD reviews in favour of CrystalDiskMark. ATTO's highly compressible data pattern gives an unrealistic view of drive performance, and including a 'best case' benchmark for the benefit of SandForce drives is becoming less relevant as SSD partners move away from the SandForce platform.
CrystalDiskMark is similar to AS SSD in its use of incompressible data files, performing sequential, 512KB and 4KB random read and write tests. it also tests with a more realistic 32 queue-depth as opposed to AS SSD's 64 queue-depth, a load that's less relevant for a home-user.
Sequential Performance
CrystalDiskMark 1,000MB
Incompressible Data, 1,000MB Sequential Read
- Samsung SSD 840 Evo 1TB (Rapid Mode)
- Samsung SSD 840 Pro 256GB
- Samsung SSD 840 250GB
- Samsung SSD 840 Evo 500GB
- Samsung SSD 840 Evo 120GB
- OCZ Vector 256GB
- Corsair Neutron GTX 240GB
- SanDisk Ultra Plus 256GB
- OCZ Vertex 4 256GB
- OCZ Vertex 450 256GB
- Crucial M500 480GB
-
-
872
-
-
-
544
-
-
-
542
-
-
-
537
-
-
-
534
-
-
-
532
-
-
-
530
-
-
-
523
-
-
-
519
-
-
-
513
-
-
-
498
-
0
100
200
300
400
500
600
700
800
900
MB/sec, Higher Is Better
-
Average Read Speed
CrystalDiskMark 1,000MB
Incompressible Data, 1,000MB Sequential Write
- Samsung SSD 840 Evo 1TB (Rapid Mode)
- Samsung SSD 840 Evo 500GB
- Samsung SSD 840 Pro 256GB
- OCZ Vector 256GB
- OCZ Vertex 450 256GB
- OCZ Vertex 4 256GB
- Corsair Neutron GTX 240GB
- SanDisk Ultra Plus 256GB
- Crucial M500 480GB
- Samsung SSD 840 Evo 120GB
- Samsung SSD 840 250GB
-
-
1060
-
-
-
525
-
-
-
525
-
-
-
524
-
-
-
518
-
-
-
508
-
-
-
456
-
-
-
448
-
-
-
424
-
-
-
414
-
-
-
260
-
0
250
500
750
1000
MB/sec, Higher Is Better
-
Average Write Speed
Random Performance
CrystalDiskMark 1,000MB
Incompressible Data, 4K Random Read, Single QD
- Samsung SSD 840 Evo 1TB (Rapid Mode)
- Samsung SSD 840 Evo 500GB
- Samsung SSD 840 Evo 120GB
- Samsung SSD 840 Pro 256GB
- SanDisk Ultra Plus 256GB
- OCZ Vertex 4 256GB
- Samsung SSD 840 250GB
- Corsair Neutron GTX 240GB
- OCZ Vector 256GB
- Crucial M500 480GB
- OCZ Vertex 450 256GB
-
-
76.67
-
-
-
44.44
-
-
-
41.10
-
-
-
38.61
-
-
-
36.56
-
-
-
31.69
-
-
-
31.48
-
-
-
30.72
-
-
-
29.81
-
-
-
28.64
-
-
-
24.64
-
0
10
20
30
40
50
60
70
80
MB/sec, Higher Is Better
-
Average Random Read Speed
CrystalDiskMark 1,000MB
Incompressible Data, 4K Random Write, Single QD
- Samsung SSD 840 Evo 1TB (Rapid Mode)
- OCZ Vertex 4 256GB
- OCZ Vector 256GB
- OCZ Vertex 450 256GB
- Crucial M500 480GB
- Samsung SSD 840 Pro 256GB
- Samsung SSD 840 Evo 500GB
- Samsung SSD 840 Evo 120GB
- Samsung SSD 840 250GB
- Corsair Neutron 240GB
- SanDisk Ultra Plus 256GB
-
-
337.30
-
-
-
134.80
-
-
-
131.30
-
-
-
129.60
-
-
-
125.60
-
-
-
120.10
-
-
-
119.70
-
-
-
119.30
-
-
-
115.30
-
-
-
110.50
-
-
-
109.80
-
0
50
100
150
200
250
300
350
MB/sec, Higher Is Better
-
Average Random Write Speed
CrystalDiskMark 1,000MB
Incompressible Data, 4K Random Read, 32 QD
- Samsung SSD 840 Pro 256GB
- Samsung SSD 840 Evo 1TB (Rapid Mode)
- Samsung SSD 840 Evo 500GB
- OCZ Vector 256GB
- Corsair Neutron GTX 240GB
- Samsung SSD 840 Evo 120GB
- Samsung SSD 840 250GB
- OCZ Vertex 4 256GB
- Crucial M500 480GB
- OCZ Vertex 450 256GB
- SanDisk Ultra Plus 256GB
-
-
407
-
-
-
405
-
-
-
405
-
-
-
401
-
-
-
391
-
-
-
391
-
-
-
389
-
-
-
358
-
-
-
356
-
-
-
348
-
-
-
336
-
0
100
200
300
400
MB/sec, Higher Is Better
-
Average Random Read Speed
CrystalDiskMark 1,000MB
Incompressible Data, 4K Random Write, 32 QD
- Samsung SSD 840 Evo 1TB (Rapid Mode)
- OCZ Vector 256GB
- OCZ Vertex 450 256GB
- Samsung SSD 840 Evo 500GB
- Samsung SSD 840 Pro 256GB
- OCZ Vertex 4 256GB
- Crucial M500 480GB
- Corsair Neutron GTX 240GB
- Samsung SSD 840 250GB
- SanDisk Ultra Plus 256GB
- Samsung SSD 840 Evo 120GB
-
-
700
-
-
-
378
-
-
-
372
-
-
-
372
-
-
-
371
-
-
-
350
-
-
-
346
-
-
-
346
-
-
-
254
-
-
-
180
-
-
-
154
-
0
100
200
300
400
500
600
700
MB/sec, Higher Is Better
-
Average Random Write Speed
Read out performance analysis.


Want to comment? Please log in.