AMD Ryzen 5 1400 Review
Written by Antony Leather
May 12, 2017 | 10:51
Tags: #1600 #1600x #1700 #am4 #amd-ryzen-5-1500x-review #amd-ryzen-5-1600-review #amd-ryzen-7-1700x-review #amd-ryzen-7-1800x-and-am4-platform-review #best-gaming-cpu #overclocking #ryzen #ryzen-1600x #ryzen-1700x #ryzen-5 #x370-1800x
Companies: #amd

Ashes of the Singularity: Esclation
Publisher: Stardock
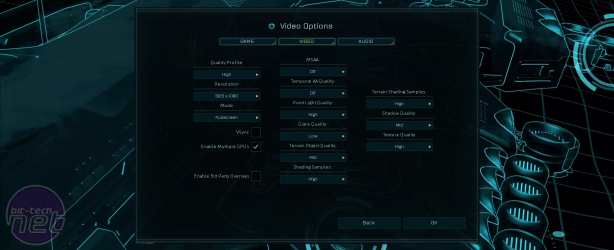
We use the built-in benchmark of Ashes of the Singularity, which runs through an automatic play-through scene in the game. We've selected the CPU-intensive benchmark option and used 'High' settings with MSAA disabled, all of which are located in the game's video options and benchmark menus. On startup, we also select the DirectX 12 version, which is only available to use in Windows 10. We use a 30-second Fraps benchmark to obtain the minimum and average frame rate during the benchmark, beginning at the start. The Escalation expansion pack is one of the first titles to have been optimised for Ryzen CPUs and shows significant performance increases.
Ashes of the Singularity: Escalation
DX12 CPU test, 'High' settings
- Intel Core i7-7700K (5GHz)
- Intel Core i7-7700K
- Intel Core i5-7600K (5.1GHz)
- AMD Ryzen 5 1600 (3.9GHz)
- AMD Ryzen 5 1600X (3.95GHz)
- AMD Ryzen 5 1600X
- AMD Ryzen 5 1600
- Intel Core i5-7600K
- AMD Ryzen 5 1400 (4GHz)
- AMD Ryzen 5 1500X (4GHz)
- AMD Ryzen 5 1500X
- Intel Core i3-7350K (5GHz)
- AMD Ryzen 5 1400
- Intel Core i3-7350K
-
-
42
-
46
-
-
-
38
-
42
-
-
-
35
-
38
-
-
-
32
-
37
-
-
-
32
-
36
-
-
-
31
-
35
-
-
-
30
-
34
-
-
-
29
-
33
-
-
-
26
-
30
-
-
-
26
-
30
-
-
-
26
-
29
-
-
-
26
-
28
-
-
-
23
-
26
-
-
-
22
-
25
-
0
10
20
30
40
50
Frames per Second
-
Minimum
-
Average
Deus Ex: Mankind Divided
Publisher: Square Enix HoldingsWe test using the 'Ultra' preset and at these settings it is currently one of the toughest games to run smoothly, presenting a challenge for even flagship graphics cards. We run the built-in benchmark (hidden in the 'Extras' menu) as it is very consistent and makes full use of the engine's features. We also rely on the game's own frame rate counter since FRAPS does not currently work with this game when using DirectX 12. We've actually found that your experience in-game will typically be with frame rates actually a little higher than the average frame rate from the benchmark, but even so it's the minimum frame rate that we focus on and that you should really take into consideration because it's in the most challenging parts of the game that you'll really feel the slowdowns, and it's no good having a sub-par experience in the heat of battle.
Deus Ex: Mankind Divided
1920 x 1080, DX12, 'High' settings
- Intel Core i7-7700K (5GHz)
- Intel Core i5-7600K (5.1GHz)
- Intel Core i7-7700K
- Intel Core i3-7350K (5GHz)
- Intel Core i5-7600K
- AMD Ryzen 5 1500X (4GHz)
- AMD Ryzen 5 1400
- AMD Ryzen 7 1700 (4.05GHz)
- AMD Ryzen 5 1500X
- AMD Ryzen 5 1400
- AMD Ryzen 5 1600X (3.95GHz)
- AMD Ryzen 5 1600 (3.9GHz)
- Intel Core i3-7350K
- AMD Ryzen 5 1600
- AMD Ryzen 5 1600X
- Intel Core i7-6850K
- Intel Core i7-6850K (4.2GHz)
- AMD Ryzen 7 1700
-
-
63
-
76
-
-
-
62
-
75
-
-
-
62
-
76
-
-
-
62
-
75
-
-
-
60
-
75
-
-
-
59
-
72
-
-
-
59
-
72
-
-
-
59
-
72
-
-
-
58
-
71
-
-
-
58
-
71
-
-
-
58
-
70
-
-
-
58
-
70
-
-
-
57
-
75
-
-
-
57
-
70
-
-
-
57
-
70
-
-
-
57
-
70
-
-
-
57
-
70
-
-
-
55
-
70
-
0
10
20
30
40
50
60
70
80
Frames per Second
-
Minimum
-
Average
Fallout 4
Publisher: Bethesda SoftworksOur Fallout 4 benchmark is a 30-second FRAPS recording of a manual playthrough, where our character runs forward through a woodland area just outside the Corvega Automation Plant. The scene is very challenging relative to the rest of the game, with massive draw distances and complex volumetric lighting. This means the results below are not representative of typical gameplay, but rather of the most challenging points in the game. We test at the game's 'Ultra' preset, the highest available, and v-sync is disabled in the game's .ini file.
Fallout 4
1,920 x 1,080, DX11, 'High' settings
- Intel Core i3-7350K (5GHz)
- Intel Core i7-7700K (5GHz)
- Intel Core i7-6850K (4.2GHz)
- Intel Core i7-6850K
- AMD Ryzen 5 1400 (4GHz)
- AMD Ryzen 5 1600 (3.9GHz)
- AMD Ryzen 5 1500X (4GHz)
- Intel Core i3-7350K
- AMD Ryzen 5 1600X (3.95GHz)
- Intel Core i7-7700K
- AMD Ryzen 7 1700X (3.95GHz)
- AMD Ryzen 7 1700 (4.05GHz)
- AMD Ryzen 5 1500X
- AMD Ryzen 5 1600X
- AMD Ryzen 5 1600
- AMD Ryzen 5 1400
- AMD Ryzen 7 1700
-
-
78
-
90
-
-
-
78
-
90
-
-
-
78
-
90
-
-
-
78
-
89
-
-
-
78
-
88
-
-
-
78
-
88
-
-
-
78
-
88
-
-
-
78
-
88
-
-
-
78
-
88
-
-
-
77
-
89
-
-
-
77
-
89
-
-
-
77
-
89
-
-
-
77
-
88
-
-
-
77
-
87
-
-
-
77
-
86
-
-
-
77
-
84
-
-
-
76
-
86
-
0
10
20
30
40
50
60
70
80
90
Frames per Second
-
Minimum
-
Average
3DMark Time Spy
Publisher: Futuremark
3DMark recently added Time Spy, a DirectX 12 benchmark that runs at 1440p. It is designed to properly utilise the advantages of the DirectX 12 API. The benchmark is available for free, but you'll need to pay to change any of the settings, including the resolution. Nonetheless, it still serves as a useful at-a-glance comparison of performance in this increasingly important API.
3DMark Time Spy
CPU test, default settings
- AMD Ryzen 7 1700 (4.05GHz)
- Intel Core i7-6850K (4.2GHz)
- Intel Core i7-6850K
- AMD Ryzen 7 1700
- Intel Core i7-7700K (5GHz)
- AMD Ryzen 5 1600X (3.95GHz)
- AMD Ryzen 5 1600X
- AMD Ryzen 5 1600 (3.9GHz)
- Intel Core i7-7700K
- AMD Ryzen 5 1600
- Intel Core i5-7600K (5.1GHz)
- AMD Ryzen 5 1500X (4GHz)
- AMD Ryzen 5 1400 (4GHz)
- Intel Core i5-7600K
- AMD Ryzen 5 1500X
- AMD Ryzen 5 1400
- Intel Core i3-7350K (5GHz)
- Intel Core i3-7350K
-
-
8575
-
-
-
6956
-
-
-
6450
-
-
-
6308
-
-
-
6243
-
-
-
6108
-
-
-
5903
-
-
-
5801
-
-
-
5740
-
-
-
5343
-
-
-
4884
-
-
-
4270
-
-
-
4204
-
-
-
4165
-
-
-
3853
-
-
-
3544
-
-
-
3214
-
-
-
2299
-
0
1000
2000
3000
4000
5000
6000
7000
8000
9000
Score (higher is better)
-
Score
VRMark
Publisher: FuturemarkVRMark is another synthetic GPU benchmark from Futuremark, this time specifically designed to assess a system's ability to handle VR gaming, with no VR headset is required. The Orange Room test assesses whether a system is capable of meeting the current minimum requirements for an Oculus Rift or HTC Vive VR headset. We run the test with its default settings, so users can easily compare scores here to the free version of this benchmark where settings cannot be changed.
VRMark - The Orange Room
2,264 x 1,348, default settings
- Intel Core i7-6850K (4.2GHz)
- Intel Core i7-6850K
- Intel Core i7-7700K (5GHz)
- Intel Core i5-7600K (5.1GHz)
- Intel Core i3-7350K (5GHz)
- Intel Core i5-7600K
- Intel Core i7-7700K
- Intel Core i3-7350K
- AMD Ryzen 5 1600X (3.95GHz)
- AMD Ryzen 5 1500X (4GHz)
- AMD Ryzen 5 1400 (4GHz)
- AMD Ryzen 5 1500X
- AMD Ryzen 5 1600 (3.9GHz)
- AMD Ryzen 5 1400
- AMD Ryzen 7 1700 (4.05GHz)
- AMD Ryzen 5 1600X
- AMD Ryzen 5 1600
- AMD Ryzen 7 1700
-
-
6021
-
-
-
6015
-
-
-
5934
-
-
-
5927
-
-
-
5924
-
-
-
5914
-
-
-
5884
-
-
-
5863
-
-
-
5860
-
-
-
5857
-
-
-
5855
-
-
-
5845
-
-
-
5844
-
-
-
5835
-
-
-
5821
-
-
-
5820
-
-
-
5801
-
-
-
5701
-
0
1000
2000
3000
4000
5000
6000
Score (higher is better)
-
Score


Want to comment? Please log in.